


8 October 2009 Edition
Wealthy, well off, old and farmers swing EU vote
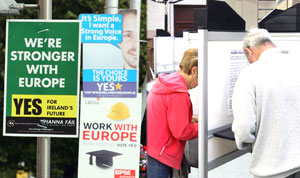
SWING: Fear and age were the resons the Yes vote won the Lisbon Treaty re-run referendum
BY ROBBIE SMYTH
SHORT-TERM class interests, fear and age won the Lisbon Treaty re-run referendum last week. Older people with jobs and pensions, others fearing they would lose theirs, larger farmers and a substantial section of suburban young people in third level colleges were the key to a growing Yes vote in the Lisbon Treaty II referendum last week.
For the record, it would seem that a 20.5% substantial swing, resulting in 67.1% voting Yes, and 32.9% No, won the day. However a combination of count tallies, and pre-referenda election polls paint a picture of an Irish electorate divided on Lisbon between high and low income voters, between young and old offers a more complex poll result.
It was clear from the early parts of the count that a slightly increased turnout up to 58% from 53.13% in 2008 had been amplified by a fall of 267,809 in the No vote. So, some voters changed their minds and some new voters came to the polls.
All but one constituency registered increases in voter turnout. It fell to Dublin South where turnout fell marginally from 58.44% in 2008 to 57.4% this time around. Dublin South also set another referendum precedent as it marginally pipped neighbouring Dún Laoghaire-Rathdown for the highest Yes vote of the day. Dublin South came in a 81.7% Yes vote compared to 81.2% in Dún Laoghaire.
In 2008 the Yes vote in the constituencies had been 62.88% and 63.46% respectively. Parts of Rathfarnham in South Dublin had Yes votes reported at 90% and 95%. So if the affluent suburbs of Dublin were voting Yes, what about other areas.
In Dublin South Central, Ballyfermot, Cherry Orchard, Crumlin and Drimnagh were coming in with a 52% No vote but when the Terenure boxes were opened the vote shifted in the constituency to 58% Yes – 42% No.
In Dublin Mid West, South Lucan was coming in at 80% Yes rising to a 5 to 1 Yes vote in Lucan Village, compared to a 70% No recorded in Quarryvale and North Clondalkin.
DONEGAL VOTES ‘NO’
The two Donegal constituencies of South West and North East were the only constituencies to record a No Vote. It should come as no surprise as this is a region where unemployment was 20,067 at the end of September compared to 12,550 a year ago and where incidence of poverty and deprivation is double the 26-County average.
However unemployment, poverty, or the lack of infrastructure were not the reason for the No vote in Donegal, according to Fine Gael TD Joe McHugh. McHugh said it was because “it started raining around lunchtime”.
Such ruses cannot hide the fact that No votes have in the last five referenda never fallen below 500,000 people and are testament to a divided Ireland. Brian Lenihan preferred the term socially differentiated to describe Dublin Mid West when asked by journalists to comment on the high No votes in parts of his constituency. However a combination of polls carried out since the first Lisbon referendum showed the true nature of the class divide in Ireland on the EU.
It is clear though that there was a swing to the Yes side, but some disillusioned No voters stayed at home this time. In the first Red C poll on Lisbon carried out in January 2009, it was apparent, according to the firm’s managing director, Richard Colwell, that 20% to 25% of those who voted No to Lisbon in 2008 would consider not voting in a second referendum. Colwell also wrote that, “Those who voted Yes last time are much more likely to turn out and vote again”.
A further poll in March affirmed a trend of 20% of No voters to consider voting Yes in a second referendum.
The eight Red C polls conducted in 2009 showed little change in voter attitudes towards Lisbon. A 62% Yes in favour of Lisbon recorded in late January, excluding don’t knows rose to 67% in the last poll a week before polling, while the No vote moved from 38% in January to 33% in late September.![]() So, unlike the first Lisbon Treaty when there was a sizable swing and erosion of support in the weeks running up to the vote, this time around it seems that voter decisions on Lisbon had been made months previously. The most significant change in voter attitudes was among first time No voters who would not vote a second time and non voters in 2008 who were going to vote in the second referendum.
So, unlike the first Lisbon Treaty when there was a sizable swing and erosion of support in the weeks running up to the vote, this time around it seems that voter decisions on Lisbon had been made months previously. The most significant change in voter attitudes was among first time No voters who would not vote a second time and non voters in 2008 who were going to vote in the second referendum.
SOCIAL DIVIDE
Also critical to the referendum outcome was the social make up of Yes and No voters. Red C found that “Younger people, especially young women are still negative towards the treaty” and that as was shown in the actual result “Connacht/Ulster was the most anti-Lisbon region, and that voters “from more affluent backgrounds” were “much more likely to be Yes voters”.
Red C also found in late September that 75% of farmers were going to support the treaty, while No voters were in a majority among working class voters, women and younger people.
However in the full time third level student social group support was tied between Yes and No voters. Compare this to the No side having a lead among the under 25s, the unemployed and married women working in the home.
The greater support among higher income voters for the Lisbon Treaty was also drawn out in an early September TNS/ MRBI poll. It found that, in the AB social group of the professional middle classes, support for the Treaty was running at 68% with only 16% voting No to Lisbon. These figures don’t exclude don’t know voters while in the lowest income groups 35% were against Lisbon compared to 32% in favour.
The TNS/MRBI poll also found that the over 65s were most supportive of Lisbon, while the 18 to 24 age group were most negative.
In 2008, the European Commission conducted a post referendum survey in the 26 Counties, some of the results of which can be seen in the 2009 polls. The Gallup 2008 survey conducted just after the referendum found that 65% of the 18-24 age group were No voters and 59% of the 25 to 39 age group.
The Gallup survey also found that 74% of manual workers voted No, 56% of the unemployed, while the 60% of the self employed voted Yes.
Another important aspect of voting behaviour highlighted in the TNS/MRBI polls was the level of support among voters who identified themselves as voting for a particular political party.
62% of Fianna Fáil voters were voting Yes compared to 23% against. In Fine Gael the Yes margin was less pronounced with 58% in favour compared to 23% against. In the Labour Party there was only 43% support for Lisbon compared to 31% against. Green Party voters were registering a 36% against Lisbon with only 31% in favour while in Sinn Féin 66% of voters were against the treaty with only 13% supporting it.
So after the 8th and possibly last referendum on EU matters, there still is the unanswered question of why some social groups feel clearly left out by the EU project and those who have the most don’t seem to care. Over half a million voters have consistently questioned the benefits of the EU project. Could it be that in the wildest chance there is an economic recovery it will be meaningless for a significant group of Irish voters.
The replayed EU treaties
Treaty Yes % No %
Lisbon II 1,214,268 67.13% 594,606 32.87%
Lisbon I 752,451 46.60% 862,415 53.40%
Nice II 906,317 62.89% 534,887 37.11%
Nice I 453,461 46.13% 529,478 53.87%
EU membership: the first four referenda
Treaty Yes % No %
Amsterdam 61.74% 38.26%
Maastricht 69.1% 30.9%
Singe European Act 69.92% 30.08%
Accession Treaty 83.1% 16.9%
RAIN STOPPED PLAY: Donegal North East, Fine Gael TD Joe McHugh