
12 January 2006 Edition
The 'freest economy' in Europe
26-County Economy - Important issues arise from new exchequer figures
The most free, the most expensive, the least taxed, the most unequal — which Ireland do you live in? As the New Year trundles on a growing amount of newly-published economic and social statistical data is showing a 26-County economy that is a mass of contradictions. This week ROBBIE SMYTH trawls the growing deluge of facts and figures asking, which Ireland do you live in?
Last week Department of Finance figures for the 26 Counties 2005 tax revenue showed that the coalition government accounts were €2.5 billion healthier than expected. The €2.5 billion overshoot comes from a combination of lower than expected departmental spending, €705 million less than forecast, and €1.75 billion in extra tax revenue.
The bonanza in tax revenue comes from increases in stamp duty, capital gains tax and contributions from the special investigations into tax evasion and undeclared offshore accounts etc. The special investigations had been forecast to bring an extra €200 million but the actual figure was €511 million.
However, not all the tax revenue figures surpassed expectations. Income tax was €350 million below forecasts. In an economy that added 96,000 new workers over the year this is a worrying trend as it confirms analysis earlier in the year that a significant amount of the new jobs created in the economy were low paid and that the wages are so low they are not paying high rates of income tax.
There are two important issues arising from the new exchequer figures, the first is what are the government going to do with the extra billions now at their disposal and if income tax growth is not driving government revenue, what effect is this having on the overall economy?
Unfortunately it isn't clear yet how government spending will be affected by the overflowing coffers; there are though some relevant precedents. Last year government spending rose by 9.3%, this might seem a high figure but it came off the back of curtailed spending increases in 2003 and 2004. In 2002, the last year of a Leinster House election spending rose by 22% in the first six months of the year, petering out after the election victory.
Perhaps the clearest guide to the Fianna Fail/Progressive Democrat coalition election strategy will be any sign of increased spending in the opening months of 2006.
On the second question of what is driving the economy, it is clear in the jobs market that huge changes are emerging and that these trends are shaping the future direction of the economy without any real public debate or decision taking on what really is the best course of action.
2005 tax figures
€39.254 billion
Total tax revenue
€2.725 billion
Stamp duty
€11.266 billion
Income tax
€12.089 billion
VAT receipts
€616 million
2005 income tax growth
€637 million
2005 stamp duty growth
€511 million
Money garnered from tax evaders
€1.396 billion
2005 increase in VAT receipts
Jobs market fantasy
Over the course of the year there have been some substantial developments in the Irish jobs market. First there has been the massive growth in employment. According to FAS, of the 96,000 new jobs created approximately 30,000 were in construction and 57,000 in services, of which a large percentage were in the public sector.
In terms of the 26 Counties presenting itself as a dynamic new economy, enterprise driven, with high-skilled productive workers the employment growth last year is clearly at odds with this fantasy.
This year our economy has been characterised by a growth in low-skilled, low-wage jobs. The crisis at Irish Ferries probably crystallised the reality of the not so far away future Irish labour market. Though the majority of Irish workers found the Irish Continental Group's, slave wage strategy repugnant, it was clear that the government was unable or unwilling to act. Within the media and wider political establishment there are those who still peddle the mantra of competitiveness without considering the consequences for Irish society of where this race to the bottom will actually end up.
The IDA said that 2005 was their best year for job creation since 2000. They aided 71 new projects. However the net job results for the IDA meant that it had only increased the number of jobs it supports by 4,296 to 133,362. In Enterprise Ireland, which promotes indigenous Irish business, employment in companies supported by them fell by 218 to 143,310. Redundancies were also at their lowest level in 2005 for four years, so it is clear that the economy is in a serious growth cycle.
What is unclear is how long more the current cycle will last, with so many workers in low paid and relatively low skilled jobs it leaves the households that these workers come from massively exposed in the context of any economic downturn. The ESRI estimated in 2005 that up to 400,000 people could fall into poverty if there was a slump in the Irish economy. This however is worrying about the unknown. What about the cost of living in the Ireland of today. How is that panning out in 2005 and '06?
2005 job figures
1,989,900
Total numbers at work
96,000
2005 jobs growth
30,000
2005 growth in construction jobs
4,296
Net change in IDA backed jobs
218
Net loss in Enterprise Ireland backed jobs
Expensive Ireland
One trend that hasn't changed over the last ten years is that the 26 Counties has become an increasingly expensive place to live. 2005 was no exception to this trend, with 2006 showing all the signs of more price rises.
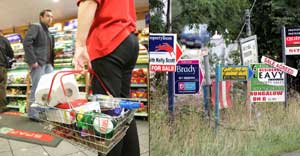
We already noted the massive rise in stamp duty, fuelled for the most part by rises in house prises. According to the Permanent TSB/ESRI figures the average growth in house prices was 8% over the first eleven months of 2005. AIB figures put the annual rise at 8.2%.
According to the ESRI figures, the average cost of a house in the 26 Counties was €275,000, the average price in Dublin was €365,562 compared with an average of €237,149 outside Dublin. In the Dublin Commuter belt of Louth, Meath, Kildare and Wicklow the average price was €294,457.
Maybe though you weren't buying a house in 2005 so the price increase didn't affect you, but you would have been affected by the November increase in interest rates which has raised mortgage rates for everyone who is on a fixed rate mortgage.
Anyway there were other price increases in 2005 which are kicking into your disposable income right now. Last July the Commission for Energy Regulation approved a 25% increase in the price An Bord Gáis can charge households and small business customers.
The VHI were allowed a levy a 12.5% increase on their customers and the ESB prices went up 4%. This week all Iarnrod Éireann, DART, Luas, Bus Atha Cliath and Bus Éireann prices rose by nearly 4%.
Then you can add petrol costs which rose substantially throughout the year. The CSO's Bi-annual Average Price Analysis found that the price of unleaded petrol rose by 7.7% in Dublin and 8.3 % outside Dublin in the 12 months to end of November 2005. Diesel prices rose by 8.9% and 9.2% respectively.
Perhaps you can take solace from the fact that the Wall Street Journal has proclaimed the 26 Counties the freest economy in Europe and third freest economy in the world. Their index measures trade and monetary policies, capital flows, wages, prices and property rights and includes 157 countries.
So get out there and smell the freedom, before someone hikes the price up!
Price rises 2005
4% — ESB
12.5% — VHI
3.8% — Public transport
7.7% — Petrol
8% — House prices
25% — Gas
0.25% — Interest rates